Java Performance I: CPU Profiling
2020-11-05 java techProblem and Context
One of the applications I work on has the purpose of calcuating indirect tax (VAT/Sales Tax) for invoices generated by a large online retailer. Sounds simple, but it’s still a few hundred thousand lines of code across a handful of deployables.
Over the last years, one complaint has occurred repeatedly: The application is getting slower with every release. Completely sensible since every release has more features and ever more complex processing, but still bad. Data Access, e.g. database queries or SOAP calls to other components, shouldn’t be the main problem. We’re caching almost all relevant data quite aggressively.
The application is running in an Openshift cluster on-premise at the customers datacenter. The development team has all the permissions necessary to do deployment and configuration tasks, but no access to cluster administration nor direct access to the nodes. No possibility to do anything real fancy.
Goals
In a recent sprint we decided to finally do something about our performance. The stated goals:
- Identify suitable tools for performance analysis - “suitable” in this case meaning “runs in openshift” and “free”.
- use those tools to identify performance Hotspots that can be improved.
- and then do the actual improving.
Approach
Since we were already reasonable sure that we’re not IO limited, since typically most of the data we use is cached, the obvious approach is CPU profiling. Wikipedia defines Profiling as follows:
In software engineering, profiling (“program profiling”, “software profiling”) is a form of dynamic program analysis that measures, for example, the space (memory) or time complexity of a program, the usage of particular instructions, or the frequency and duration of function calls.
Dynamic program analysis in this case meaning an analysis performed during program runtime (as opposed to static analyses like the ones performed by Sonar, Checkstyle, Findbugs, and so on).
Right now, we’re especially interested in the part about “duration of function calls”.
Tool Selection
There are several profiling tools available for the JVM. We’ve looked at three of them:
- JProfiler
- Async Profiler
- JFR. Also known as Java Flight Recorder, or just Flight Recorder
- Flow
JProfiler is a commercial tool which look quite nice, but didn’t fit the “free” aspect of our requirements. And even if “free” wasn’t a requirement: The licensing doesn’t look trivial enough for a development team to make any form of decision on it. For doing the analyses in Openshift, possibly on multiple pods in parallel, we probably would have needed signoff from some kind of corporate lawyer. A bit disappointing, I really would have liked to play around with it.
Flow is a free to use but closed source IntelliJ plugin. It produces beautiful (and unusually readable) flame graphs and nice visual representations of call graphs between packages, classes or methods. Since its currently only supported within IntelliJ, it’s not a good fit for our scenario.
Async Profiler is a relatively recent open source project for profiling on HotSpot based JVMs like OpenJDK or Oracle JDK. The “Basic Usage” part of the projects README starts out with some sysctl tuning. That’s certainly not going to happen in our cluster, given our limited permissions. There are alternative configurations were those settings are not needed, but that first step was already not that motivating. We probably also would have had to change our Docker Images to contain the profiling agent libraries (also suprisingly complicated in our setup), and then we’d have had another piece of software to keep up to date. Not that attractive, at least within our environment.
Side-Note: Async Profiler is the default profiling tool used by IntelliJ and is actually pretty nice when used locally.
This leaves the Flight Recorder. JFR was a commercial feature of the oracle JDK for a few years, but was open sourced starting at JDK 11 and is now available in OpenJDK. Awesome.
Since it’s already part of our JDK, there’s nothing new to install. There are no JVM startup parameters required to use it, either. JFR can be started inside a running JVM using the jcmd tool. Also pretty great. So that’s what we’re using.
How to actually start profiling
Locally, in IntelliJ
Current versions of IntelliJ have a ‘Run with CPU Profiler’ button beside the Run, Debug, and Run with Coverage buttons. By default, it uses async profiler (at least on Linux), but JFR can also be selected.
Locally, via JMC
According Oracle’s Documentation, “JDK Mission Control (JMC) is an advanced set of tools for managing, monitoring, profiling, and troubleshooting Java applications.”
Specifically, JMC allows can connect to running JVMs to interact with JMX MBeans or access Flight Recorder. It probably also has other features.
As with JFR, it used to be commercial, but has been open-sourced. The current version (as of Nov 2020) can be downloaded at https://jdk.java.net/jmc/.
To profile using JMC, connect to a running JVM via File->Connect, select Start Flight Recording and select the appropriate settings in the following dialogue steps.
Remotely and containerized
Let’s be honest: even if we can - in principle - connect JMC to the Java process in a container in a pod in an Openshift cluster via port-forwarding, I don’t think we really want to. So we need a better way.
That better way is jcmd. It’s a command-line tool that’s part of all modern JDKs and allows us to list running JVM processes and interact with them in a few different ways. Some of those interactions are starting and stopping the Flight Recorder, and writing recordings to the filesystem.
Here’s an example session with the Openshift CLI:
 1$ oc rsh my-pod-name
 2
 3sh-4.2$ jcmd
 41 /deployments/application.jar
 5154 jdk.jcmd/sun.tools.jcmd.JCmd
 6
 7sh-4.2$ jcmd 1 help
 81:
 9The following commands are available:
10[...]
11JFR.check
12JFR.configure
13JFR.dump
14JFR.start
15JFR.stop
16[...]
17help
18
19For more information about a specific command use 'help <command>'.
20
21sh-4.2$ jcmd 1 JFR.start name=my-recording
221:
23Started recording 2. No limit specified, using maxsize=250MB as default.
24
25Use jcmd 1 JFR.dump name=my-recording filename=FILEPATH to copy recording data to file.
26
27sh-4.2$ mkdir -p /tmp/recordings/
28
29sh-4.2$ jcmd 1 JFR.dump name=my-recording filename=/tmp/recordings/recording.jfr
301:
31Dumped recording "my-recording", 373.8 kB written to:
32
33/tmp/recordings/recording.jfr
34
35sh-4.2$ jcmd 1 JFR.stop name=my-recording
361:
37Stopped recording "my-recording".
And now we’ve written a JFR recording to the containers /tmp filesystem and can copy it back to our own machine with oc rsync, in this case oc rsync my-pod-name:/tmp/recordings .
This file can be opened either with Mission Control (“File”->“Open File”), or in IntelliJ (“Run”->“Open Profiler Snapshot”).
Since our setup may require us to collect profiling data across multiple pods in parallel, we now have a small shell script to the jcmd steps above on multiple pods based on a label selector. It’s not interesting enough to reproduce here, so I’ll leave that as an exercise to the reader.
Example profile from our Application
After opening the snapshot in IntelliJ, we are greeted by this beautiful panel:
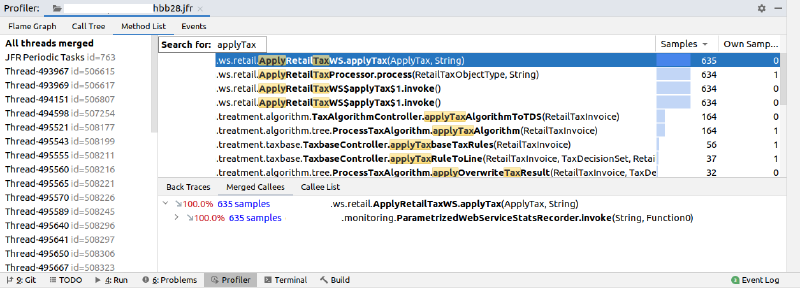
The first thing we’ll do instead is to go to the “Method List” tab, and search for our slow SOAP Service, ApplyRetailTaxWS.applyTax:
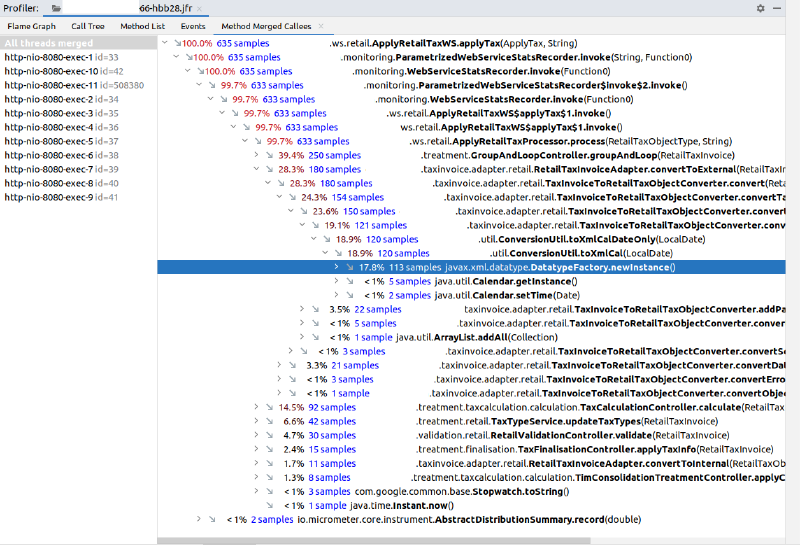
We can view the “Method Merged Callees” for applyTax after right-clicking on the method. The Method Merged Callees view shows all methods that were called by applyTax, all methods called by those, and so on, recursively. For each method we get a percentage number indicating how much of the applyTax-related time was spent in that method or its callees.
So now we can go exploring where applyTax spends its time. One interesting point is that we seem to be spending a lot of time in DatatypeFactory.newInstance() calls while converting Dates in our internal invoice structure back to the XML objects used by the SOAP layer:
Turns our, the conversion code looks something like this:
 1public static XMLGregorianCalendar toXmlCal(LocalDate date ) {
 2    if ( date == null ) {
 3        return null;
 4    }
 5    GregorianCalendar calendar = (GregorianCalendar) GregorianCalendar.getInstance();
 6    calendar.setTime( Date.from(date.atStartOfDay(ZoneId.systemDefault()).toInstant()) );
 7    try {
 8        XMLGregorianCalendar xmlGregorianCalendar = DatatypeFactory.newInstance().newXMLGregorianCalendar( calendar );
 9        return xmlGregorianCalendar;
10    }
11    catch ( DatatypeConfigurationException e ) {
12        return null;
13    }
14}
As far as we can tell from the documentation, DatatypeFactory objects are in fact not only re-usable, but also thread-safe. So we changed that class to only create one DatatypeFactory at application startup and then use that for all date-conversions. Great.
Another nice finding was that we spent quite a bit of time in Hibernate-related code. I mentioned at the start that all of our data was cached. Turn’s out, it wasn’t. One specific query was still performed at least once per incoming request. The offending method was clearly visible both in the back traces from - in our case - CriteriaImpl.list(), as well as the time spent below applyTax(). So we had a new candidate for caching.
Caveats
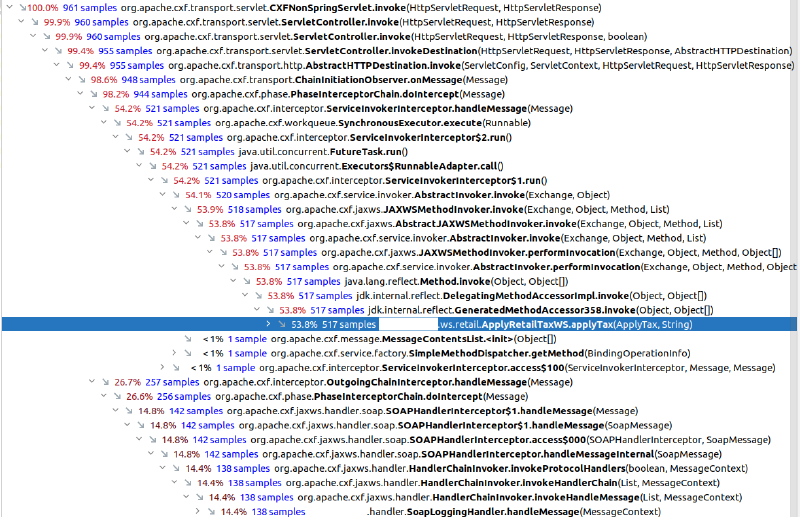
I mentioned a few times that we’re using SOAP. I also stated that we started our analyzing just the actual web service implementation. Which means that the surrounding SOAP stack (Apache CXF) and the Web Application Framework were outside of the scope of our analysis. Our reasoning was that we don’t have a lot influence on that code and analyzing parts of the application we can’t actually optimize seemed like a waste of time. So here’s a little Screenshot containing not only our webservice implementation, but also the SOAP entrypoint in CXF:
Two things to note here:
- Almost half the time spent inside the SOAP call is not spent within our ApplyTax method.
- The very last line of the screenshot is a SOAP Interceptor written by us a handful of years ago, that we kind of forgot because nobody ever works on that part of the code. Not only was our assumption incorrect that applyTax is the only part of the SOAP call that we’re responsible for, we actually missed a pretty significant hotspot because of that assumption.
Summary and Future topics
There were a few interesting learnings for my team and me:
- Profiling a java application running in a container somewhere in the cloud isn’t massively more difficult than profiling locally. We should do more of that.
- It’s incredibly easy to focus on a too narrow part of the application and miss large performance hotspots.
- There’s lots of tooling available and honestly: All of it looks pretty good. Try them all out, see what works best for you!
There are of course many more things we can try to improve our analyses:
- We only really looked at one application, but there can be interactions (via SOAP or other HTTP based APIs) between a handful of different deployables. Distributed tracing tools like Jaeger or Zipkin might be helpful to get a better understanding of that.
- We are already publishing a few simple metrics to Prometheus via Spring Actuator. Looking at long-term trends in that data might be worth a try.
- There’s also some potential gain by looking at memory usage in more detail. JDK Mission Control can make a few suggestions for GC tuning by looking at a JFR dump.